


Congressional District 7, Wisconsin
About
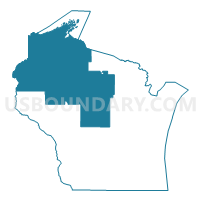
Outline

Summary
| Unique Area Identifier | 118743 |
| Name | Congressional District 7 |
| State | Wisconsin |
| Area (square miles) | 19,391.04 |
| Land Area (square miles) | 18,751.94 |
| Water Area (square miles) | 639.10 |
| % of Land Area | 96.70 |
| % of Water Area | 3.30 |
| Latitude of the Internal Point | 45.58848870 |
| Longtitude of the Internal Point | -90.84664330 |
| Total Population | 689,279 |
| Total Housing Units | 368,655 |
| Total Households | 283,587 |
| Median Age | 41.8 |
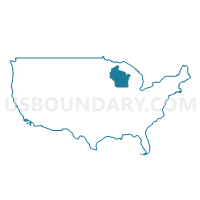
Maps
Graphs
Select a template below for downloading or customizing gragh for Congressional District 7, Wisconsin


Neighbors
Neighoring 111th Congressional District (by Name) Neighboring 111th Congressional District on the Map
- Congressional District 1, MI
- Congressional District 3, WI
- Congressional District 6, WI
- Congressional District 6, MN
- Congressional District 8, WI
- Congressional District 8, MN
Top 10 Neighboring County (by Population) Neighboring County on the Map
- Washington County, MN (238,136)
- St. Louis County, MN (200,226)
- Marathon County, WI (134,063)
- Eau Claire County, WI (98,736)
- St. Croix County, WI (84,345)
- Wood County, WI (74,749)
- Portage County, WI (70,019)
- Chippewa County, WI (62,415)
- Chisago County, MN (53,887)
- Waupaca County, WI (52,410)
Top 10 Neighboring County Subdivision (by Population) Neighboring County Subdivision on the Map
- Duluth city, St. Louis County, MN (86,265)
- Eau Claire city, Eau Claire County, WI (63,902)
- Wausau city, Marathon County, WI (39,106)
- Superior city, Douglas County, WI (27,244)
- Stevens Point city, Portage County, WI (26,717)
- Wisconsin Rapids city, Wood County, WI (18,367)
- Marshfield city, Wood County, WI (18,218)
- Weston village, Marathon County, WI (14,868)
- Chippewa Falls city, Chippewa County, WI (13,661)
- Plover village, Portage County, WI (12,123)
Top 10 Neighboring Place (by Population) Neighboring Place on the Map
- Duluth city, MN (86,265)
- Eau Claire city, WI (65,883)
- Wausau city, WI (39,106)
- Superior city, WI (27,244)
- Stevens Point city, WI (26,717)
- Marshfield city, WI (19,118)
- Wisconsin Rapids city, WI (18,367)
- Weston village, WI (14,868)
- Chippewa Falls city, WI (13,661)
- Plover village, WI (12,123)
Top 10 Neighboring Elementary School District (by Population) Neighboring Elementary School District on the Map
- Minocqua Joint No. 1 School District, WI (6,701)
- Lac du Flambeau No. 1 School District, WI (3,438)
- North Lakeland School District, WI (2,513)
Top 10 Neighboring Secondary School District (by Population) Neighboring Secondary School District on the Map
Top 10 Neighboring Unified School District (by Population) Neighboring Unified School District on the Map
- Duluth Public School District, MN (95,252)
- Eau Claire Area School District, WI (80,993)
- Stillwater Area Public School District, MN (59,454)
- Stevens Point Area School District, WI (56,433)
- Wausau School District, WI (54,246)
- Forest Lake Public School District, MN (45,564)
- Wisconsin Rapids School District, WI (34,949)
- Superior School District, WI (33,892)
- D.C. Everest Area School District, WI (33,511)
- Chippewa Falls Area School District, WI (33,046)
Top 10 Neighboring State Legislative District Lower Chamber (by Population) Neighboring State Legislative District Lower Chamber on the Map
- State House District 110, MI (83,484)
- Assembly District 29, WI (66,814)
- Assembly District 86, WI (59,763)
- Assembly District 28, WI (59,273)
- Assembly District 50, WI (59,182)
- Assembly District 68, WI (59,129)
- Assembly District 69, WI (59,107)
- Assembly District 92, WI (58,894)
- Assembly District 67, WI (58,722)
- Assembly District 71, WI (57,415)
Top 10 Neighboring State Legislative District Upper Chamber (by Population) Neighboring State Legislative District Upper Chamber on the Map
- State Senate District 38, MI (261,728)
- State Senate District 10, WI (192,662)
- State Senate District 23, WI (176,958)
- State Senate District 31, WI (173,352)
- State Senate District 17, WI (172,391)
- State Senate District 14, WI (168,782)
- State Senate District 29, WI (167,310)
- State Senate District 24, WI (167,083)
- State Senate District 25, WI (162,546)
- State Senate District 12, WI (157,332)
Top 10 Neighboring Census Tract (by Population) Neighboring Census Tract on the Map
- Census Tract 1204, St. Croix County, WI (10,513)
- Census Tract 12.01, Marathon County, WI (8,096)
- Census Tract 11.02, Marathon County, WI (7,996)
- Census Tract 704, Carlton County, MN (7,822)
- Census Tract 1206, St. Croix County, WI (7,569)
- Census Tract 107, Chippewa County, WI (7,226)
- Census Tract 9604, Portage County, WI (7,212)
- Census Tract 21, Marathon County, WI (7,190)
- Census Tract 23, Marathon County, WI (7,169)
- Census Tract 110, Chippewa County, WI (7,085)
Top 10 Neighboring 5-Digit ZIP Code Tabulation Area (by Population) Neighboring 5-Digit ZIP Code Tabulation Area on the Map
- 54703, WI (42,272)
- 54729, WI (31,469)
- 54880, WI (30,772)
- 54401, WI (30,702)
- 54481, WI (29,340)
- 54494, WI (27,126)
- 54449, WI (26,418)
- 54403, WI (24,272)
- 54501, WI (20,019)
- 54452, WI (19,360)
Data
Demographic, Population, Households, and Housing Units
** Data sources from census 2010 **
Show Data on Map
Download Full List as CSV
Download Quick Sheet as CSV
| Subject | This Area | Wisconsin | National |
|---|---|---|---|
| POPULATION | |||
| Total Population Map | 689,279 | 5,686,986 | 308,745,538 |
| POPULATION, HISPANIC OR LATINO ORIGIN | |||
| Not Hispanic or Latino Map | 676,435 | 5,350,930 | 258,267,944 |
| Hispanic or Latino Map | 12,844 | 336,056 | 50,477,594 |
| POPULATION, RACE | |||
| White alone Map | 646,834 | 4,902,067 | 223,553,265 |
| Black or African American alone Map | 4,379 | 359,148 | 38,929,319 |
| American Indian and Alaska Native alone Map | 11,091 | 54,526 | 2,932,248 |
| Asian alone Map | 12,764 | 129,234 | 14,674,252 |
| Native Hawaiian and Other Pacific Islander alone Map | 187 | 1,827 | 540,013 |
| Some Other Race alone Map | 4,378 | 135,867 | 19,107,368 |
| Two or More Races Map | 9,646 | 104,317 | 9,009,073 |
| POPULATION, SEX | |||
| Male Map | 346,035 | 2,822,400 | 151,781,326 |
| Female Map | 343,244 | 2,864,586 | 156,964,212 |
| POPULATION, AGE (18 YEARS) | |||
| 18 years and over Map | 533,578 | 4,347,494 | 234,564,071 |
| Under 18 years | 155,701 | 1,339,492 | 74,181,467 |
| POPULATION, AGE | |||
| Under 5 years | 41,277 | 358,443 | 20,201,362 |
| 5 to 9 years | 41,827 | 368,617 | 20,348,657 |
| 10 to 14 years | 43,981 | 375,927 | 20,677,194 |
| 15 to 17 years | 28,616 | 236,505 | 12,954,254 |
| 18 and 19 years | 17,797 | 162,704 | 9,086,089 |
| 20 years | 8,126 | 80,763 | 4,519,129 |
| 21 years | 7,779 | 78,216 | 4,354,294 |
| 22 to 24 years | 23,537 | 227,573 | 12,712,576 |
| 25 to 29 years | 39,473 | 372,347 | 21,101,849 |
| 30 to 34 years | 37,541 | 349,347 | 19,962,099 |
| 35 to 39 years | 38,764 | 345,328 | 20,179,642 |
| 40 to 44 years | 44,439 | 380,338 | 20,890,964 |
| 45 to 49 years | 54,455 | 437,627 | 22,708,591 |
| 50 to 54 years | 55,612 | 436,126 | 22,298,125 |
| 55 to 59 years | 50,835 | 385,986 | 19,664,805 |
| 60 and 61 years | 18,102 | 135,437 | 7,113,727 |
| 62 to 64 years | 24,255 | 178,388 | 9,704,197 |
| 65 and 66 years | 13,808 | 96,316 | 5,319,902 |
| 67 to 69 years | 19,177 | 130,713 | 7,115,361 |
| 70 to 74 years | 26,002 | 173,467 | 9,278,166 |
| 75 to 79 years | 20,391 | 141,252 | 7,317,795 |
| 80 to 84 years | 16,449 | 117,061 | 5,743,327 |
| 85 years and over | 17,036 | 118,505 | 5,493,433 |
| MEDIAN AGE BY SEX | |||
| Both sexes Map | 41.80 | 38.50 | 37.20 |
| Male Map | 40.80 | 37.30 | 35.80 |
| Female Map | 42.90 | 39.60 | 38.50 |
| HOUSEHOLDS | |||
| Total Households Map | 283,587 | 2,279,768 | 116,716,292 |
| HOUSEHOLDS, HOUSEHOLD TYPE | |||
| Family households: Map | 186,556 | 1,468,917 | 77,538,296 |
| Husband-wife family Map | 148,827 | 1,131,344 | 56,510,377 |
| Other family: Map | 37,729 | 337,573 | 21,027,919 |
| Male householder, no wife present Map | 13,377 | 103,625 | 5,777,570 |
| Female householder, no husband present Map | 24,352 | 233,948 | 15,250,349 |
| Nonfamily households: Map | 97,031 | 810,851 | 39,177,996 |
| Householder living alone Map | 78,872 | 642,507 | 31,204,909 |
| Householder not living alone Map | 18,159 | 168,344 | 7,973,087 |
| HOUSEHOLDS, HISPANIC OR LATINO ORIGIN OF HOUSEHOLDER | |||
| Not Hispanic or Latino householder: Map | 280,607 | 2,194,432 | 103,254,926 |
| Hispanic or Latino householder: Map | 2,980 | 85,336 | 13,461,366 |
| HOUSEHOLDS, RACE OF HOUSEHOLDER | |||
| Householder who is White alone | 272,945 | 2,045,544 | 89,754,352 |
| Householder who is Black or African American alone | 866 | 122,878 | 14,129,983 |
| Householder who is American Indian and Alaska Native alone | 3,727 | 18,213 | 939,707 |
| Householder who is Asian alone | 2,769 | 35,407 | 4,632,164 |
| Householder who is Native Hawaiian and Other Pacific Islander alone | 55 | 548 | 143,932 |
| Householder who is Some Other Race alone | 1,069 | 35,432 | 4,916,427 |
| Householder who is Two or More Races | 2,156 | 21,746 | 2,199,727 |
| HOUSEHOLDS, HOUSEHOLD TYPE BY HOUSEHOLD SIZE | |||
| Family households: Map | 186,556 | 1,468,917 | 77,538,296 |
| 2-person household Map | 94,589 | 680,856 | 31,882,616 |
| 3-person household Map | 38,169 | 319,637 | 17,765,829 |
| 4-person household Map | 32,049 | 276,516 | 15,214,075 |
| 5-person household Map | 13,825 | 121,740 | 7,411,997 |
| 6-person household Map | 4,864 | 43,643 | 3,026,278 |
| 7-or-more-person household Map | 3,060 | 26,525 | 2,237,501 |
| Nonfamily households: Map | 97,031 | 810,851 | 39,177,996 |
| 1-person household Map | 78,872 | 642,507 | 31,204,909 |
| 2-person household Map | 15,195 | 136,394 | 6,360,012 |
| 3-person household Map | 1,821 | 19,899 | 992,156 |
| 4-person household Map | 761 | 8,016 | 411,171 |
| 5-person household Map | 252 | 2,647 | 126,634 |
| 6-person household Map | 81 | 861 | 48,421 |
| 7-or-more-person household Map | 49 | 527 | 34,693 |
| HOUSING UNITS | |||
| Total Housing Units Map | 368,655 | 2,624,358 | 131,704,730 |
| HOUSING UNITS, OCCUPANCY STATUS | |||
| Occupied Map | 283,587 | 2,279,768 | 116,716,292 |
| Vacant Map | 85,068 | 344,590 | 14,988,438 |
| HOUSING UNITS, OCCUPIED, TENURE | |||
| Owned with a mortgage or a loan Map | 132,300 | 1,082,099 | 52,979,430 |
| Owned free and clear Map | 78,836 | 469,459 | 23,006,644 |
| Renter occupied Map | 72,451 | 728,210 | 40,730,218 |
| HOUSING UNITS, VACANT, VACANCY STATUS | |||
| For rent Map | 7,157 | 63,268 | 4,137,567 |
| Rented, not occupied Map | 510 | 3,695 | 206,825 |
| For sale only Map | 4,761 | 34,219 | 1,896,796 |
| Sold, not occupied Map | 856 | 5,741 | 421,032 |
| For seasonal, recreational, or occasional use Map | 64,616 | 193,046 | 4,649,298 |
| For migrant workers Map | 52 | 249 | 24,161 |
| Other vacant Map | 7,116 | 44,372 | 3,652,759 |
| HOUSING UNITS, OCCUPIED, AVERAGE HOUSEHOLD SIZE BY TENURE | |||
| Total: Map | 2.38 | 2.43 | 2.58 |
| Owner occupied Map | 2.48 | 2.56 | 2.65 |
| Renter occupied Map | 2.09 | 2.16 | 2.44 |
| HOUSING UNITS, OCCUPIED, TENURE BY RACE OF HOUSEHOLDER | |||
| Owner occupied: Map | 211,136 | 1,551,558 | 75,986,074 |
| Householder who is White alone Map | 206,140 | 1,466,172 | 63,446,275 |
| Householder who is Black or African American alone Map | 229 | 37,360 | 6,261,464 |
| Householder who is American Indian and Alaska Native alone Map | 1,817 | 8,742 | 509,588 |
| Householder who is Asian alone Map | 1,388 | 17,078 | 2,688,861 |
| Householder who is Native Hawaiian and Other Pacific Islander alone Map | 22 | 279 | 61,911 |
| Householder who is Some Other Race alone Map | 398 | 12,746 | 1,975,817 |
| Householder who is Two or More Races Map | 1,142 | 9,181 | 1,042,158 |
| Renter occupied: Map | 72,451 | 728,210 | 40,730,218 |
| Householder who is White alone Map | 66,805 | 579,372 | 26,308,077 |
| Householder who is Black or African American alone Map | 637 | 85,518 | 7,868,519 |
| Householder who is American Indian and Alaska Native alone Map | 1,910 | 9,471 | 430,119 |
| Householder who is Asian alone Map | 1,381 | 18,329 | 1,943,303 |
| Householder who is Native Hawaiian and Other Pacific Islander alone Map | 33 | 269 | 82,021 |
| Householder who is Some Other Race alone Map | 671 | 22,686 | 2,940,610 |
| Householder who is Two or More Races Map | 1,014 | 12,565 | 1,157,569 |
| HOUSING UNITS, OCCUPIED, TENURE BY HISPANIC OR LATINO ORIGIN OF HOUSEHOLDER | |||
| Owner occupied: Map | 211,136 | 1,551,558 | 75,986,074 |
| Not Hispanic or Latino householder Map | 209,874 | 1,516,656 | 69,617,625 |
| Hispanic or Latino householder Map | 1,262 | 34,902 | 6,368,449 |
| Renter occupied: Map | 72,451 | 728,210 | 40,730,218 |
| Not Hispanic or Latino householder Map | 70,733 | 677,776 | 33,637,301 |
| Hispanic or Latino householder Map | 1,718 | 50,434 | 7,092,917 |
| HOUSING UNITS, OCCUPIED, TENURE BY HOUSEHOLD SIZE | |||
| Owner occupied: Map | 211,136 | 1,551,558 | 75,986,074 |
| 1-person household Map | 45,755 | 325,993 | 16,453,569 |
| 2-person household Map | 90,789 | 623,027 | 27,618,605 |
| 3-person household Map | 30,616 | 241,709 | 12,517,563 |
| 4-person household Map | 26,650 | 220,084 | 10,998,793 |
| 5-person household Map | 11,126 | 91,979 | 5,057,765 |
| 6-person household Map | 3,822 | 31,002 | 1,965,796 |
| 7-or-more-person household Map | 2,378 | 17,764 | 1,373,983 |
| Renter occupied: Map | 72,451 | 728,210 | 40,730,218 |
| 1-person household Map | 33,117 | 316,514 | 14,751,340 |
| 2-person household Map | 18,995 | 194,223 | 10,624,023 |
| 3-person household Map | 9,374 | 97,827 | 6,240,422 |
| 4-person household Map | 6,160 | 64,448 | 4,626,453 |
| 5-person household Map | 2,951 | 32,408 | 2,480,866 |
| 6-person household Map | 1,123 | 13,502 | 1,108,903 |
| 7-or-more-person household Map | 731 | 9,288 | 898,211 |
Loading...